Planning You plan a sales model to converge towards targets for key metrics over time. In this section, we’ll discuss those metrics and then show how a driver-based model can be an invaluable tool for planning the evolution of your sales model.
Key Metrics, company level Copy link
ARR growth rate: how fast are you growing ARR? Copy link
Public companies often do not release ARR and ergo calculate growth on revenue or implied ARR (last quarter subscription revenue * 4)
Customer acquisition cost (CAC) ratio: how much do you spend to acquire $1 of new ARR? Copy link
- Net New ARR (inclusive of churn) is a higher bar than New ARR
- New ARR is better measure of sales performance
- Net New ARR is a better measure of company performance
- Public companies often calculate based on revenue or implied ARR and this is almost always calculated on a net basis (as they often release neither ARR nor churn numbers)
CAC payback period = how many months of gross margin are needed to pay back the cost of customer acquisition? Copy link
- CAC Payback Period = CAC Ratio / Subscription Gross Margin x 12
- How long is your customer acquisition "money on the table" before you are paid back?
Net revenue retention (NRR): how fast does ARR expand within existing customers? Copy link
- ARR of year-ago cohort today / ARR of year-ago cohort a year ago
- Also known as net dollar retention (NDR)
Rule of 40 score = how do you balance growth and profit? Copy link
- Rule of 40 score = ARR growth rate + free cash flow (FCF) margin
- Public companies will define growth using revenue; others use EBITDA or operating margin instead of FCF
- This metrics is less meaningful (and less examined) for early-stage companies
Key company metrics, sales level Copy link
Sales productivity: ARR/ramped-seller Copy link
- Most companies model productivity (expected result) and then uplift to quota (seller targets)
- Quota is typically set about 20% higher than expected productivity
- To simplify calculations and ease interpretation, this usually excludes ramping sellers
- Varies by seller type (e.g. enterprise vs. corporate sales)
Quota attainment: Percent of ramped sellers at 80%+ of quota Copy link
- Warning: this is a function of cadence
- Example: if you have annual compensation plans, then 80% at 80% is a high but achievable bar on annual basis, but virtually impossible on a quarterly basis
- Some people base this metric on 80% attainment (which typically equals expected productivity) whereas others base it on 100%
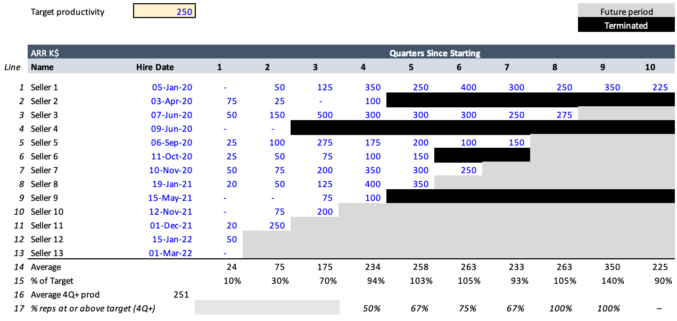
- This Seller Ramp chart tracks the historical productivity of every seller
- It can be used to determine steady-state seller productivity (average 4Q+ productivity)
- It can also be used to determine seller ramp: imagine the company models sellers doing 0%, 25%, 75% and 100% of their target in their first four quarters. Here you can see the reality is slightly better in the first three quarters (at 10%, 31%, 75%) and slightly worse in the fourth at 91%.
What is a driver-based planning model? Copy link
A high-level model that lets you vary key parameters (i.e. the drivers) and see resulting impacts (e.g. key metrics) Copy link
This is not a budget. It's a high-level model, meaning it factors in things such as coarse time granularity (quarters, not months), some imprecision (it is approximate), intent (scenario planning, not budgeting – i.e. it does not map to general ledger accounts!), and abstraction (total number of sellers hired vs. one row per seller).
The more a driver-based planning model resembles a budget, the harder it is to use for scenario planning.
A good model should include: Copy link
- Sales bookings capacity – given sales hiring, productivity, ramping, and attrition, how much can we sell?
- The ARR leaky bucket – give our sales and churn assumptions what happens to our bucket of ARR?
- High-level P&L – given the ARR bucket and assumptions about S&M, R&D, G&A, and COGS what does the income statement look like?
- Cash – given existing cash, new bookings, renewals, and cash expenses, what does cash look like?
If the columns are months, if it has one row per seller, if you need to copy and paste rows to add new sellers, and to map expenses to general ledger accounts, it’s a budget – not a driver-based model Copy link
Such budgets are too detailed and cumbersome to meet your planning needs.
FP&A people tend towards driver-based models, while accountants/controllers tend towards budgets.
Read more on the merits of driver-based models.
Key metrics: inputs or outputs? Copy link
Sometimes, people get this backwards so let’s make it clear: the outputs of the model are key metrics, and the inputs are operational drivers. The model shows you the impact of varying different drivers and their impact on key metrics.
Example Outputs Copy link
- New ARR bookings
- Ending ARR and ARR growth
- CAC ratio
- CAC payback period
- Net retention
- Rule of 40 score
- FCF margin
Example Inputs Copy link
- Sales productivity
- Sales hiring plan
- Sales attrition
- Expansion %
- Churn %
- Services attach rate
- Subscription and services margins
- Sales staffing, OTEs, and ratios
- Marketing funnel conversion rates and costs
- R&D and G&A %
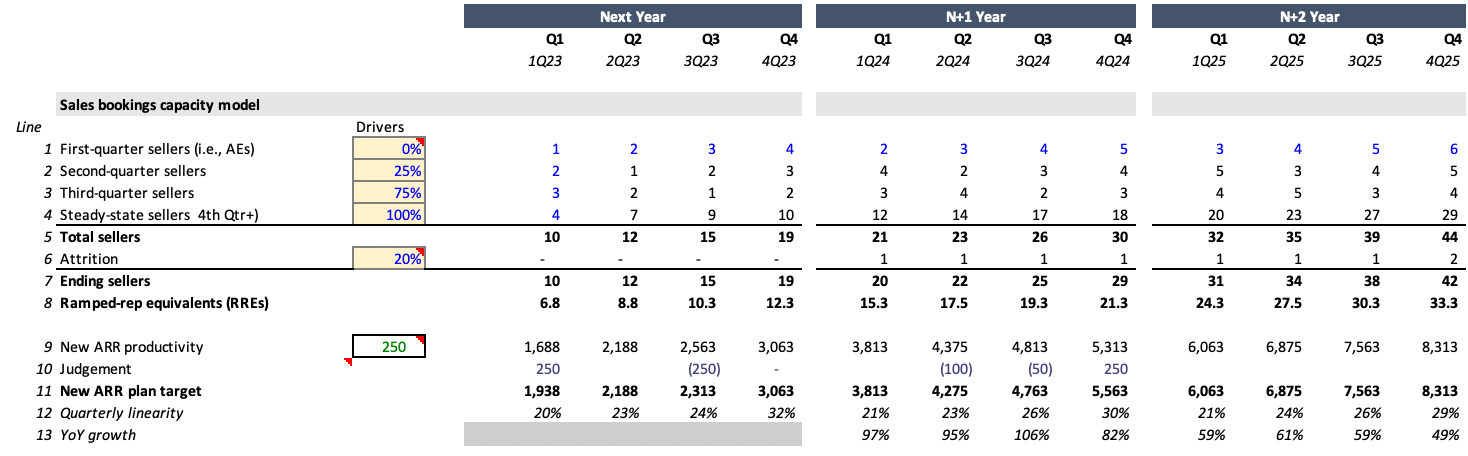
Example sales booking capacity model Copy link
Copy link
Above is an example of a simple sales bookings capacity model. A few things to note:
- If you have different types of sellers (e.g. inside, enterprise), you'll need one block like this per type of seller
- This model lets you see the bookings impact of varying drivers like productivity, attrition, ramping, and hiring
- Sometimes companies end up with model wars, where the director of sales ops has one model and the head of finance has another. Compel them to compromise on a single model to end these wars
- The art of building these models is identifying which drivers to use and where and how to approximate - e.g. expansion ARR could be a single top-down number (e.g. % of new ARR from expansion) or it could be an attach-rate to a new product offering
Example sales-linked marketing inverted funnel model Copy link
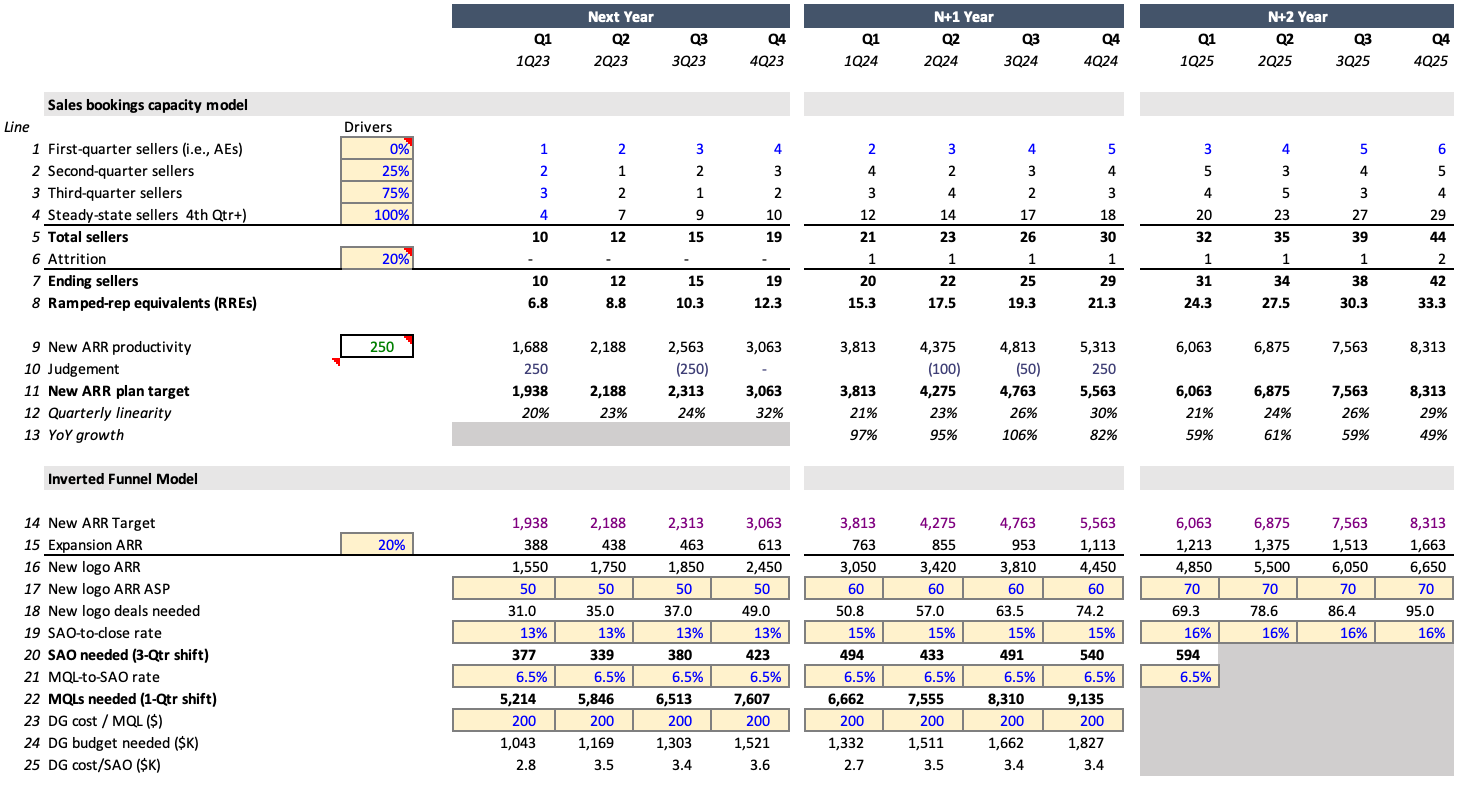
The above model links a sales booking capacity model to a marketing inverted funnel model.
- It phase-shifts opportunity generation by two quarters for the sales cycle and lags opportunity creation by one quarter from MQL creation.
- Calculating opportunities needed along with cost/opportunity enables reverse-engineering the demand-gen portion of the marketing budget.
- It also helps ensure that sufficient pipeline is being generated early enough to support the needs of sales. Timing matters.
The importance of driver-based modelling Copy link
Driver-based models are key planning tools that keep you out of the budgeting weeds and help you to understand how the key levers of your business drive your core performance metrics.
Identifying key levers – your choice of model determines your drivers Copy link
There is an art to driver-based modelling. For example, consider these different approaches to modelling expansion and sales.
Modelling expansion: annual price increase, usage-expansion assumptions, consumption assumptions, edition upgrades, top-down %.
Modelling sales: seller productivity model, a marketing-to-sales funnel, or a trial conversion rate.
See how they interact Copy link
With driver-based modelling, you can easily see the effect on ARR growth of changing sales ramping, turnover, ASP, or sales productivity.
Isolate drivers for operational focus Copy link
Example: we can hit our CAC goal if we increase sales productivity from $225K/quarter - now, let's make a plan to do that.
Enable scenario analysis Copy link
You can define scenarios by picking logically consistent sets of driver values. For example, mid-market push vs. enterprise expansion.
Establish a three-year trajectory Copy link
The top planning mistake is to make an optimistic P&L for Year 1 that under-invests to support growth in year 2. With a three-year model, you are always looking at a longer trajectory to avoid this problem. Don’t drive looking at the hood ornament!
Thoughts on benchmarks Copy link
Benchmarks are a necessary evil in B2B sales Copy link
- They're necessary because they help with comparison to industry norms and can inspire improvement
- Evil because they are easily misinterpreted and/or cherry-picked
To use benchmarks correctly: Copy link
- Ensure relevant comparison set (e.g. by size, sales model, ARR size, capital raised)
- Use benchmarks from multiple sources (to help find differences, deepen understanding)
- Don't just focus on the median, look at the distribution
- Remember that metrics are a function of strategy and sales model
- Variances can be offset (e.g. a high CAC could be justified by an exceptional NRR)
Remember that many key metrics are hard to change Copy link
- You are unlikely to drop your CAC ratio from 2.2x to 1.1x in a year
- Think about convergence over time

*Estimates, Benchmarks and Analysis based on our experience with leading European SaaS companies
Glideslope planning Copy link
The below model does glideslope planning, where we create a long-term model and show our glideslope to converge to key targets over time.

In this model we use multiple benchmarks, past actuals, the current-year plan and the next two year’s models to drive a discussion about key metrics, benchmarks, long-term targets, and our convergence to them over time.
To learn more about planning Copy link
- KeyBanc SaaS metrics survey by KeyBank
- RevOps Squared SaaS benchmarks by RevOps Squared
- Scale Up by the Numbers by Insight Partners
- OpenView SaaS metrics by OpenView Partners
- Scaling to 100M playbook, by Bessemer Venture Partners
- Opex Engine benchmarking by Bain Capital
- Sirius Decisions (now owned by Forrester)
- Topo (now owned by Gartner)