Managing Managing a sales organisation is about cadence, process, and discipline.
Cadence Copy link
You are your timing. Cadence is an important topic on which you should make deliberate choices. Copy link


Copy link
For the rest of this guide, we will, by default, assume a quarterly cadence, larger deals, with 2-3 quarter sales cycles. Please map to your situation accordingly.
Cadence examples Copy link
The four key fields of opportunities Copy link
You should have written rules for how to fill in each of these four key fields. Otherwise, you will aggregate data with a wildly inconsistent set of assumptions – and that problem will only get worse as you scale.
For example
- Value should be entered only after it has been discussed with the customer
- Close date should be the date the customer says they want to purchase by
- Stages should have defined exit criteria (e.g. solution fit confirmed)
- Forecast categories should generally map to probabilities (e.g. commit 90%, forecast 70%, upside 30%, and unlikely 0%)
Throughout this process, keep definitions simple – complexity creates confusion and ambiguity.
If there are five Stage-3 exit criteria and you have met four of them, what stage is the opportunity? (We’ve seen systems where you can actually win the deal before meeting all Stage-3 exit criteria!)
Example stages and definitions Copy link
What is a pipeline scrub? Copy link
A pipeline scrub is a periodic meeting to review and validate all opportunities in the pipeline Copy link
Without them, the pipeline quality quickly degenerates.
A scrub should proceed rep by rep, reviewing every opportunity in their pipeline, for the current quarter and all future quarters Copy link
Future periods quickly become dumping grounds if not scrubbed. Delaying deals into the future can hide losses and enable squatting on accounts.
Particular attention should be paid to the four key fields Copy link
Close date, value, stage, and forecast category.

Questioning should be direct and customer-in, not seller-out Copy link
What did the customer say to make you believe you were in stage 5? Who said it? When did the customer say the evaluation process would complete? Who said that?
Pipeline scrubs should be exclusively focused on pipeline quality and verification Copy link

Pipeline scrubs should happen several times (e.g. three) per quarter Copy link
Meeting at the end of weeks two, five, and eight works well for sales teams on quarterly cadence. Beware of sales managers who are “always" scrubbing the pipeline. In this case, always is likely to mean never.
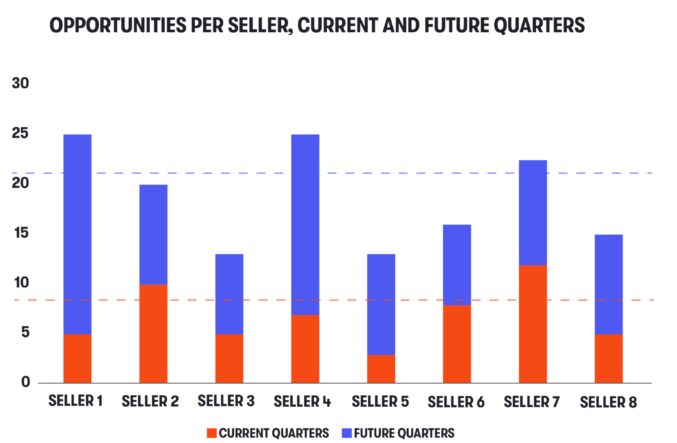
While much attention is paid to pipeline coverage (value of pipeline compared to targets), it’s often easier and more intuitive to ask: how many opportunities can a seller actually manage?
It helps to split that by timeframe – e.g. current-quarter opportunities usually require more focus and attention than future ones.
It also helps to split by type of seller – e.g. a velocity seller turning a high volume of small deals can handle more than an enterprise seller working a small number of large transactions.
In this fairly typical enterprise example, the goals are indicated by the dashed lines. The company would like sellers to have nine current-quarter and 21 all-quarters opportunities in their pipeline at the start of a quarter.
Breaking this out via a bar chart is important because averages can hide very uneven distributions amongst sellers.
Forecasting and probabilities Copy link
Copy link
When it comes to forecasting: Copy link
- Sellers tend to be optimistic (i.e. have “happy ears”)
- Sellers tend towards imprecise language (e.g. “best case” or "if the stars align")
- Sellers tend to resist probabilities (e.g. “we can’t win half a deal”)
To combat these tendencies, do the following: Copy link
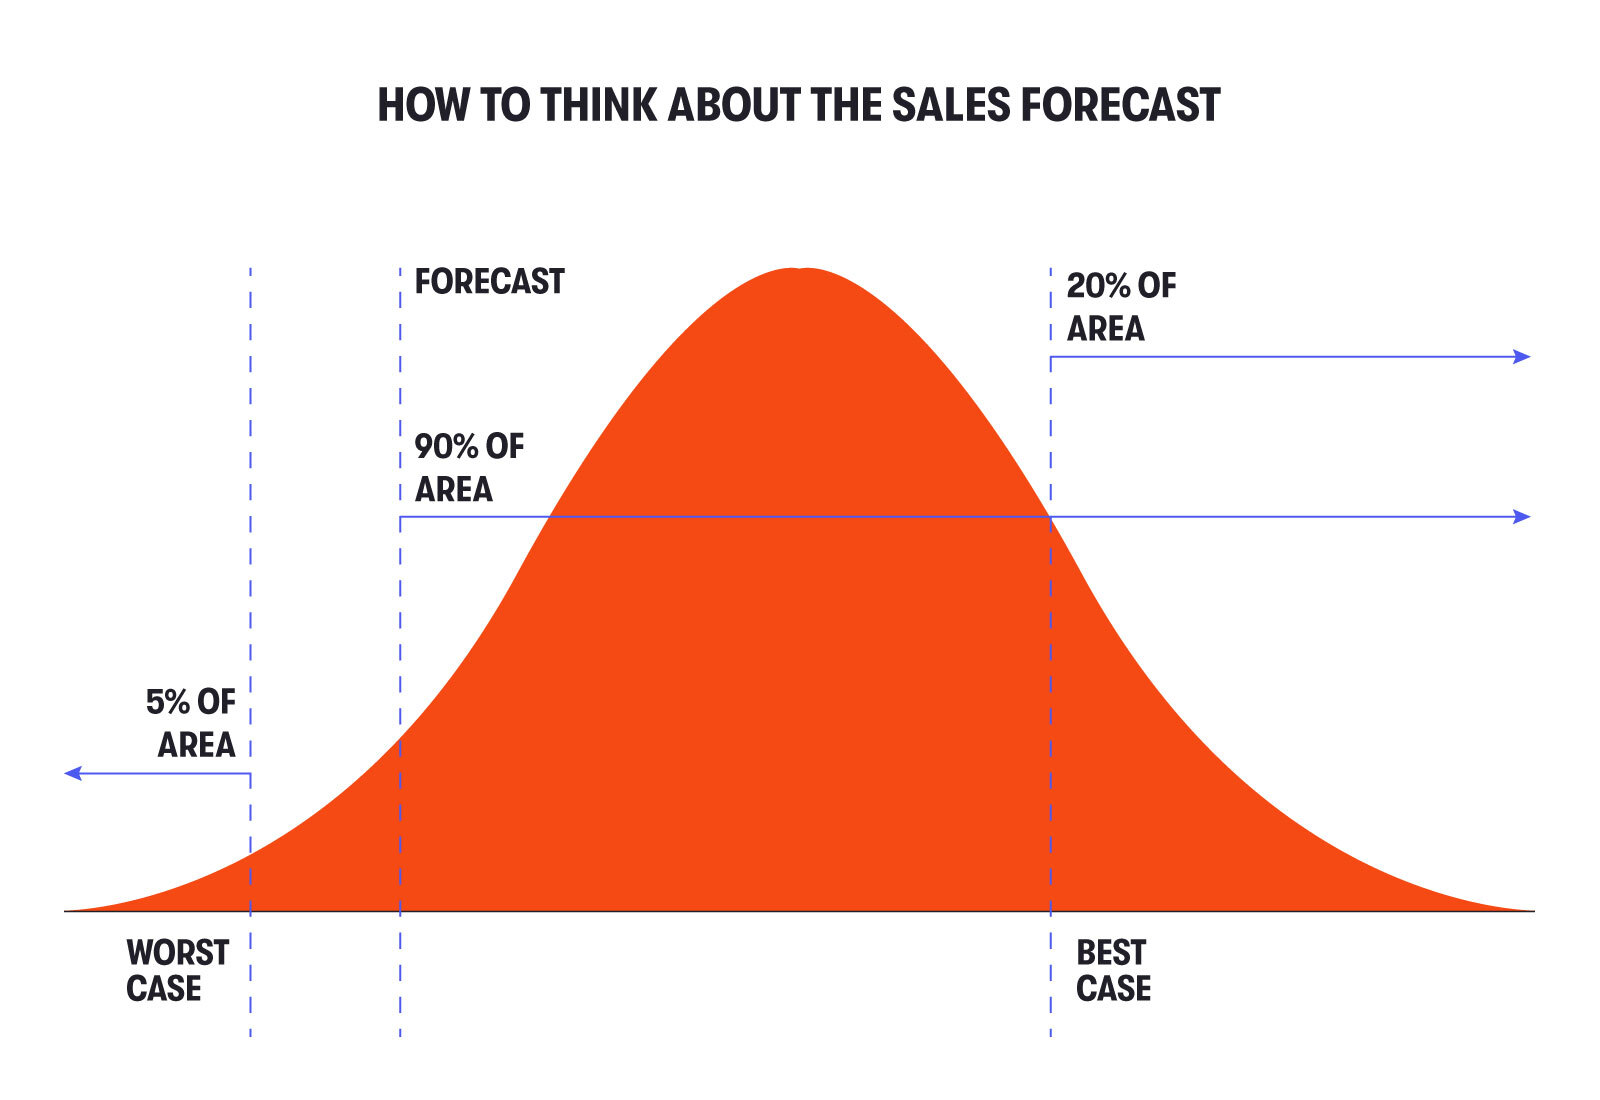
- Define the VP-level sales forecast number as a 90% probability – that is, they get to miss it once every 2.5 years
- If you also want a best-case, define that as well – 90% chance of beating forecast, 20% chance of beating best-case
- Use forecast category as probability of individual deals closing
Define the forecast in terms of probabilities, but do not impose rules on how the forecast is made. Copy link
Most sales leaders use scenario analysis to arrive at their forecast. You should consider their forecast an independent prediction; use triangulation to see the bigger picture.
The word "commit" Copy link
Sales leaders use the word “commit” in different and potentially confusing ways Copy link
SidebarSome use it as contract between seller and manager on a given deal
That means, if you “commit a deal,” you are personally guaranteeing it will close. This is often combined with early-quarter pressure to commit certain deals, which is then used to increase pressure on the seller later in the quarter (“you committed that deal, now you have to win it.”). This is a high-pressure sales management technique that is increasingly going out of favour.
Others use “commit” as a synonym for “forecast” (or high-confidence forecast)
Asking, “Jane, what’s your commitment for this quarter?”. I would suggest using “forecast” with a probabilistic definition (e.g. 90%) instead.
Many use “commit” as a forecast category for a given deal Copy link
Typical forecast categories and associated probabilities include: pipeline*/unlikely 0%, upside 30%, forecast** 70%, commit 90%.
*Using “pipeline” as a forecast category is indeed confusing, but is still fairly common. “Unlikely” is an alternative, preferred term.
**Using “forecast” as a forecast category is potentially confusing too, so ensure the context is clear.
Triangulation forecasts Copy link
You should ask the head of sales for a forecast every week to ensure: Copy link
- Accountability
- Incorporation of new information
- Ability to analyse trends
You should triangulate that against other indicators, such as: Copy link
- Pipeline coverage – value of pipeline / target (typically on a to-go basis)
- Rep-level forecast – the sum of the individual sellers’ forecasts will be typically larger than the head of sales forecast, but not always
- Expected values (also known as weighted pipeline) with the expected value of the pipeline calculated based on weights assigned to stages or forecast categories i.e. If we have $1,000K in stage 5 with a 40% probability of closing, then the stage-weighted expected value of that pipeline is $400K
The weekly forecast sheet Copy link
Copy link
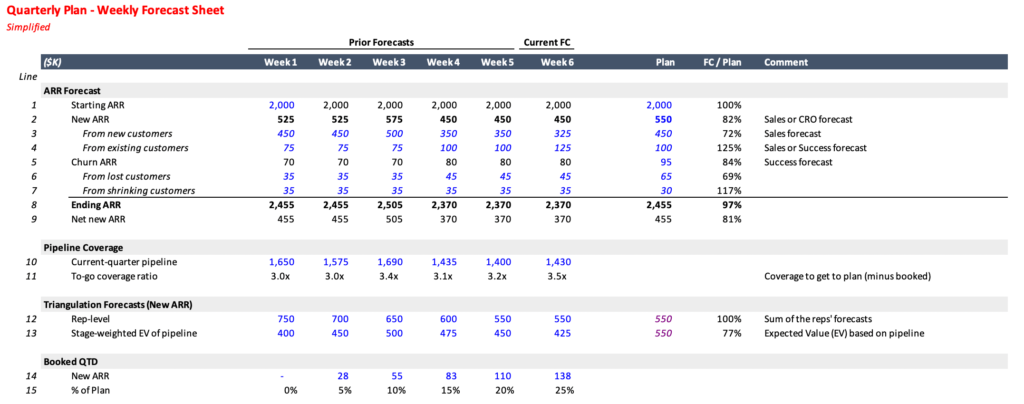
Tracking the forecast every week should be done via a sheet like this. It's important to watch how the forecast varies across weeks of the quarter and to hold the CRO accountable for the shape of that curve.
It includes a weekly New ARR forecast from Sales, and a weekly Churn forecast from Customer Success.
It shows pipeline coverage, the ratio between how much pipeline there is in play and how much more needs to be sold.
It shows three different triangulation forecasts that you can compare to the CRO forecast.
- Sum of the reps’ forecasts
- The pipeline’s stage-weighted expected value (EV)
- The pipeline’s forecast-category-weighted EV
In order to keep a strong focus on closing, some managers ask sellers to forecast on both their quarterly performance and the coming week’s closed deals.
This keeps sellers focused on the details of closing transactions and reduces deals stacking up at the end of the quarter.
Some managers use this technique only in the final month of each quarter.
For large deals, asking for short, written “close plans” can also be useful to ensure sales understands and is managing the process of closing the transaction.
Deal reviews Copy link
Winning deals, particularly in the enterprise, is complex because it involves: Copy link
- Multiple buyer roles: user, champion, economic buyer, approver, IT/standards, procurement
- Multiple competitors: incumbents, hyper-scalers, startups
- Defined process: RFI, RFP, demo, presentation, proof of concept, committee, purchasing
A deal review is a meeting where sales management and interested peers come together to learn about a deal and focus on generating ideas to win it Copy link
- Example problems: “We know that competitor X will say Y," or “we know that buying from a startup is a major concern for the CFO”
- Frequent problem: We don’t know what we don’t know – the peer group can help a seller to identify important missing information and generate ideas on how to get it
Deal reviews should happen on-demand, called by a seller or their manager when they feel they could benefit from the assistance of the team.
Keep deal reviews positive and focused on winning to ensure that sellers will call them when needed.
With the good intention of reducing meetings, some sales managers try to combine pipeline scrubs, forecast calls, and deal reviews into a single meeting.
This is almost always a mistake.
Pipeline scrubs should be long, disciplined, systematic walk-throughs.
Given the length of the meeting, it can be segmented by region so the entire team doesn’t need to sit through the entire scrub.
Forecast calls should be used to quickly run through the numbers.
- What are you calling?
- Where’s it coming from?
- How did it change?
- What help do you need to keep things moving?
Deal reviews should be opt-in meetings where people come together to help. Copy link
The seller should spend 10 to 30 minutes discussing each deal by outlining the situation. The team, consisting of management and peers, should then work together to find the best path to victory.
Keep these meetings and their functions separate and you won't regret it.
Quarterly Business Reviews (QBRs) Copy link
What are they? Copy link
Post-quarter meetings with the executive team, sales management, and sellers to review the previous quarter and plan for the next. As you scale, you'll run QBRs by region.
Key metrics Copy link
You should review key metrics using a salesops-generated standard template that includes:
- New ARR performance (absolute, plan-relative, YTD, YoY)
- New ARR by type (new vs. expansion, net new ARR)
- New ARR forecast accuracy (week 3 forecast / result)
- Churn performance and forecast accuracy
- Pipeline conversion (new ARR / week 3 pipeline)
- Pipeline opportunity count (opportunities/seller)
- Pipeline progression
- Marketing funnel analysis
- Quarterly employee net promoter score (NPS)
Key analyses Copy link
You should also present the results of key analyses, which should include:
- Win/loss analysis (e.g. key deals, quantitative, third-party)
- Churn analysis (via some taxonomy)
- Quarterly customer satisfaction (CSAT) analysis, including NPS
- Segment analysis (if applicable, by use-case, vertical, or sales channel)
The quest for repeatability Copy link
Many people will ask you if you have a repeatable sales model. Few can define what that means.
Repeatability is about producing a standard result given a set of standard inputs such as: Copy link
- Standard hiring profile – background/experience of new hires
- Standard training program – onboarding, but also ongoing
- Standard support ratios – SCs, SDRs, managers, alliances
- Standard territory
- Standard kit – messaging, presentations, demonstrations, collateral
- Standard sales process – and, as you get bigger, a sales methodology
Can you produce a standard result? Copy link
- For example, an 80% chance of a seller producing at 80%+ of quota in one year.
Proving repeatability Copy link
Proving repeatability is hard and takes time Copy link
Many companies can’t define the six standard inputs due to the following:
- Ad hoc organisations: roles, goals, and ratios have been created in an ad hoc and/or regional manner
- Standards exist, but have been ignored: notionally the company hires people with background X, but few people actually have it
- Elements are missing: there is no standard onboarding because no one has built it
Step one: standardise the six inputs Copy link
This often entails hiring sales enablement and salesops, as well as potentially upgrading sales management.
Step two: determine the measurement criteria for results Copy link
- High-level metrics are important but less conclusive: e.g. plan attainment
- Micro-metrics are precise, but potentially not relevant: onboarding final exam scores
- Results-oriented metrics work best, but take time to accumulate: cohort performance relative to ramp, cohort survival rate, % of reps at 80%+ of annual quota
To learn more about managing Copy link
Additional resources on managing Copy link
- Beginner’s Guide to the Sales Process by Zendesk
- Why To Creates Opportunities at Zero Value by Dave Kellogg
- SaaS Sales Management Tips by Joel York
- Cracking the Sales Management Code by Jason Jordan
- The Holy Grail of Enterprise Sales: Defining the Repeatable Sales Process by Dave Kellogg